Test With Me

Window of Failure

I don’t want to be the type of tester who brings a developer a bug and proclaims “It’s broken!” with nothing more to add. This leads to frustrated developers and the perception that testers only deliver bad news. Because I am the testing specialist on my team, it’s my job to bring issues of quality to the attention my team members. How I present those issues shapes how I’m viewed by my fellow team members. I like to provide as much information as I can in my bug reports because it’s less work for the developer to do when they go to fix the bug. A bug can occur anywhere between when a user inputs text on a form through to the database behind a server. The window of failure is the components of your system under test that you haven’t ruled out as possibly containing the bug. The more I can do to narrow down the window of failure, the more valuable my bug reports are and the faster a developer can commit a fix.

Let’s imagine a situation in which a form is not saving data because a required field is not being sent to the server because a bug exists in the data binding between the HTML and javascript. These are all possible ways to explain the issue to a developer:

  • The form is broken
    • This provides the developer little information about the actual problem and the failure can be occurring anywhere from the client to the server. I cannot rule out any piece of the system.
  • The form breaks when I press the save button
    • This gives some steps to reproduce which helps the developer reliably reproduce the issue on their local environment at least, but I still cannot rule out any piece of the system.
  • The form is broken because there is an error in the javascript console
    • This will likely provide the developer with a stack-trace to help narrow down the window of failure, but the onus is on the developer to narrow down where the issue is occurring.
  • The data is not saving because a 400 Bad Request error is being returned from the server
    • This information will narrow the window of failure considerably in that we know that the data being sent to the server is not formatted correctly when coming from the client. From this information, I can safely assume that the bug is not in the server-side code or issues with the database.
  • The javascript is throwing an error about a property being undefined on the model
    • What this tells me is that the error is most likely in the binding between the HTML and javascript and the window of failure is narrowed to the client HTML/Javascript interaction. This shows an understanding of how the application is written and provides the developer with a very narrow window of failure letting them focus on what the eventual fix is.

At times, the most difficult part of fixing a bug is understanding where the application is broken. Once it’s understood where the break is, it could be as easy as a one line change that fixes the issue. Getting better at narrowing down the bugs window of failure allows the developer to focus on the fix.

Where this can get you into trouble is spending too much time trying to narrow the window of failure. We all like to solve puzzles, but sometimes it’s best left to those who are best positioned to solve them. More often than not, the very best person to find the cause of a bug is the person who wrote the code. If I can spend a reasonable amount of time narrowing down the window of failure even just a little, it’s worth the time. Otherwise, my time would be better spent doing more testing. There are a lot of times where I have no idea what is causing a defect, but I do my best to provide as much information as I can to help others reproduce the issue. It’s all about finding a balance between testing and providing the most valuable bug report.


If I’ve done all this work finding where the break in the application is, why don’t I just fix the bug? Often times I will, but I’ll leave that to a different post.
Testing File Attachments

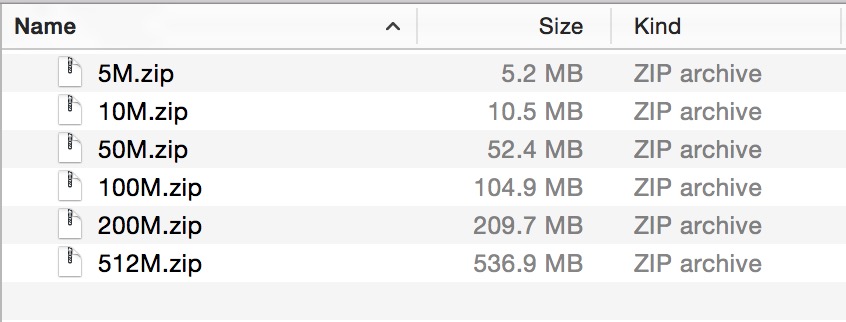
The chat product I’ve been working on recently started allowing attachments to be added to conversations. In order to fully test this feature, I thought it would be good to create a couple folders with helpful file types and sizes. In order to create a file of a specific size, I used the mkfile command illustrated below:

1
mkfile -n 100m 100M.zip

You can specify the size using the following letters: b(ytes), k(ilobytes), m(egabytes), and g(igabytes). I found a couple bugs using these files where the chat windows did not handle file attachments greater than the size limit very well.

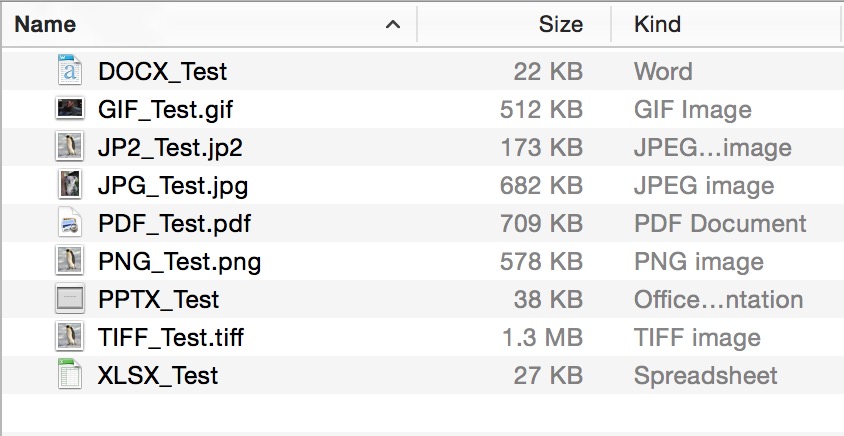
For file types, I created some files with common file types. Given that we show previews for certain files, I wanted to make sure we supported most of the common file types.

I have both of these folders located in my favorites column in the OS X finder. Having these folders in a location that’s easily accessible made testing file attachments pretty effortless. Making testing more efficient is something I’m always working on and having these files handy makes it so that any time working with file attachments, I can rotate through them quickly and maybe find a bug or two.

The Productive Tester

I think we’ve all had the experience of somebody asking or emailing, “Hey, what’s going on with DE4288?”. Unless I have been looking at that defect in the last 2 minutes, I have no idea what you’re talking about. For the longest time, I would open up the browser, navigate to our cloud based agile software development tracker, search around, eventually find what I’m looking for, and then ask you what it was you wanted. There had to be a better way! Using Automator (OS X only), I created a simple service that allows me to highlight a defect number (DE4288 for example) and it will open up Chrome and take me directly to the defect or user story. All it takes is this simple bash script:

1
/usr/bin/open -a "/Applications/Google Chrome.app" https://rally1.rallydev.com/slm/rally.sp?#/search?keywords=$@

Obviously this specific example will only work with Rally, but I think the idea remains the same – Rather than just focusing on ‘automating’ your checks, why not automate repetitive things that annoy you.


My second tip uses a piece of software called Text Expander (also OS X only). Using their formatted text snippet builder, whenever I type ‘bbug’, a little window pops up with a form that looks like this:

Which after I’m done, formats to something looking like this:

I’ve found this is a really nice way to have consistent looking steps to reproduce and makes sure I have at least the bare minimum defect logged for the developer.

Introducing Charter

tl;dr A command line tool for creating a test charter exported in markdown or html.

Work has been looking to formalize our exploratory testing efforts and the idea of exploratory test charters was brought up. From there, I read up on Session Based Testing and found it intriguing. I started looking for something to help me in my session based testing efforts: something lightweight, unobtrusive, and exports the charter in a useful format. When I didn’t find anything that I thought would fit my needs, I starting writing Charter. It’s a simple command line tool for creating and exporting test charters in Markdown or HTML. I took this as an opportunity to brush up on my Ruby skills and create something that perfectly met my needs. Charters are saved in a folder with any defect screenshots associated with the charters. My team uses the Github wiki with our repository so I have my charters saving to a folder in the wiki repository so they are publicly accessible if needed. Tags can be added to charters and Charter will find all charters with a given tag. Charter is currently OS X only with no immediate plans to verify if it works on Windows yet. Take a look and try Charter out for yourself! I would love some feedback!

You can find the source on Github here and as a Ruby gem here.

Installation

Charter was created as a Ruby gem and is available through Rubygems.org. Installation is as simple as:
[sudo] gem install charter

After installing the gem, create a ~/.charterrc file and add the following:

1
2
3
4
       ---
        session_folder: "/Where/The/Charters/Will/Save/To"
        tester: Your Name Here
    

Usage

charter [global options] command [command options] [arguments...]

Creating a new charter is as easy as charter start “My charter title here”. This will create a new charter in the folder specified in your ~/.charterrc file.

charter purpose “This is my purpose!” : What do you hope to accomplish with this charter
charter env “Windows 7” : Add a environment description
charter scenario “Scenario goes here” or charter s “Scenario goes here” : Add a scenario
charter bug “This is my bug” or charter bug -s “My bug” : Add a bug with or without a screenshot
charter note : Add a note
charter tag “Login” : Add a tag to the charter
charter finish or charter finish -e : Remove any remaining placeholders and optionally export the charter in HTML
charter find Login : Find all charters with a given tag

See an example charter here

Introduce Some Chaos Into Your Testing

A little over a year ago, the Netflix Tech Blog posted an article revealing to the the world Chaos Monkey. Chaos Monkey will terminate virtual machines in Netflix’s AWS cloud infrastructure…in production to make sure they can handle it. That’s right, in production. I would have loved to be in the meeting where the dev ops team presented this.

The web application I am currently testing is heavily client based, meaning that most of the data coming into the application comes from AJAX calls made directly from the browser rather than the server. As with any good web application, it has to respond well to failure, serving up nice error messages and failing gracefully. For each user story, I can test to make sure that when the feature receives failing status codes (401,403,404,500…etc), it responds appropriately, but I wanted something more, so I wrote Chaos Proxy.

Due to some frustrating corporate policy, I cannot post the source code for Chaos Proxy. Take a look at the Github Repo. Chaos Proxy is a C# console app written using Eric Lawrence’s Fiddlercore library. On startup, Chaos Proxy will ask you for what percentage of calls you want to fail, what status code you want to respond with, the external service’s hostname you want to intercept, and the site you are testing. After that, Chaos Proxy will intercept the calls before they ever leave your machine and return the intended status code. The intercepted calls appear in the console window so you can see which calls failed. At some point in time, I plan to add some more chaos into the mix by randomizing which status codes get returned.

I have run it with 10, 20, and 30% failure rates during exploratory testing and have found some very interesting defects that I may not have found otherwise. I think that introducing a bit of randomness and chaos into exploratory testing is increasingly valuable. Some testers and developers fall into the trap of thinking everybody using their product has a blazing fast Internet connection, a 1080p monitor, and is running chrome. I believe that my job as a tester is to account for those poor souls who are running IE 8 on XP. API calls will fail on occasion, and my application will be ready.